PROTECTING THE HEART OF KEAUKAHA
Our home of Keaukaha, is at a crossroads. Recent data shows a dramatic spike in park visitors from 2024 to 2026, driven largely by an increase in commercial tour groups.
This growth has brought more than just crowds; it has brought traffic risks, frustrated community members, blocked driveways and a loss of the “serenity” that defines our home. We are working to mitigate these impacts through the Kuʻu Home Stewardship Pilot Program and the development of a community-led Tourism Management Plan.
This initiative began at the grassroots level. Residents first noted the expansion of commercial tourism into Keaukaha before the pandemic, and since Hawaiʻi’s reopening, the area has seen an unprecedented and steady influx of visitors and commercial influence.
To track these changes, the founder of Waiuli We Count began informal data collection at Waiuli Beach Park in 2023. This effort expanded in late 2024 through a partnership with the Keliʻi William Ioane Legacy Foundation and the County of Hawaiʻi Department of Research & Development to include Lehia Park at the end of the road. By 2025, monitoring grew to include Waiuli, Lehia, Kealoha Paka, and Onekahakaha beach parks.
The following reports summarize data collected throughout each month to keep our stakeholders and community informed.
Usage by Year & Month
Image 1: shows an increase in park use attendance. Data collected between Nov 2024 and January 2025 is displayed on the left bar graph. The bar graph on the right shows park use data collected in the same time period between 2025 and 2026. These numbers represent ALL park users including Hawaii Island residents, tourists accessing the park in their own vehicles, as well as commercial use of the park.
Data in purple represent access of Onekahakaha beach Park; Yellow represents access at Kealoha Paka ( 4-miles); Green data represents usage of Waiuli; and blue represents data collected at Lehia Beach Park, also known as Kingʻs Landing.
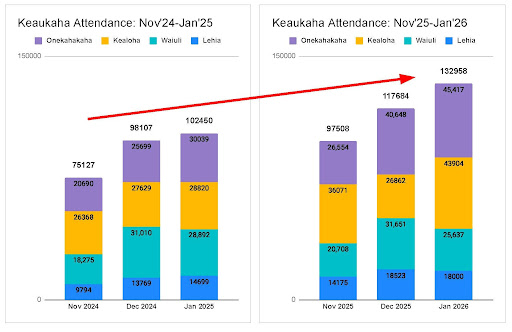
Image 2-3: shows the estimated number of people accessing the Parks in Keaukaha. This number is alarming! The amount of people entering Keaukaha has been steadily increasing, reaching over 1 million in 2025!
This is equivalent to one quarter of Waikiki’s visitation even though the usable beachfront, budget, and infrastructure is much more limited.
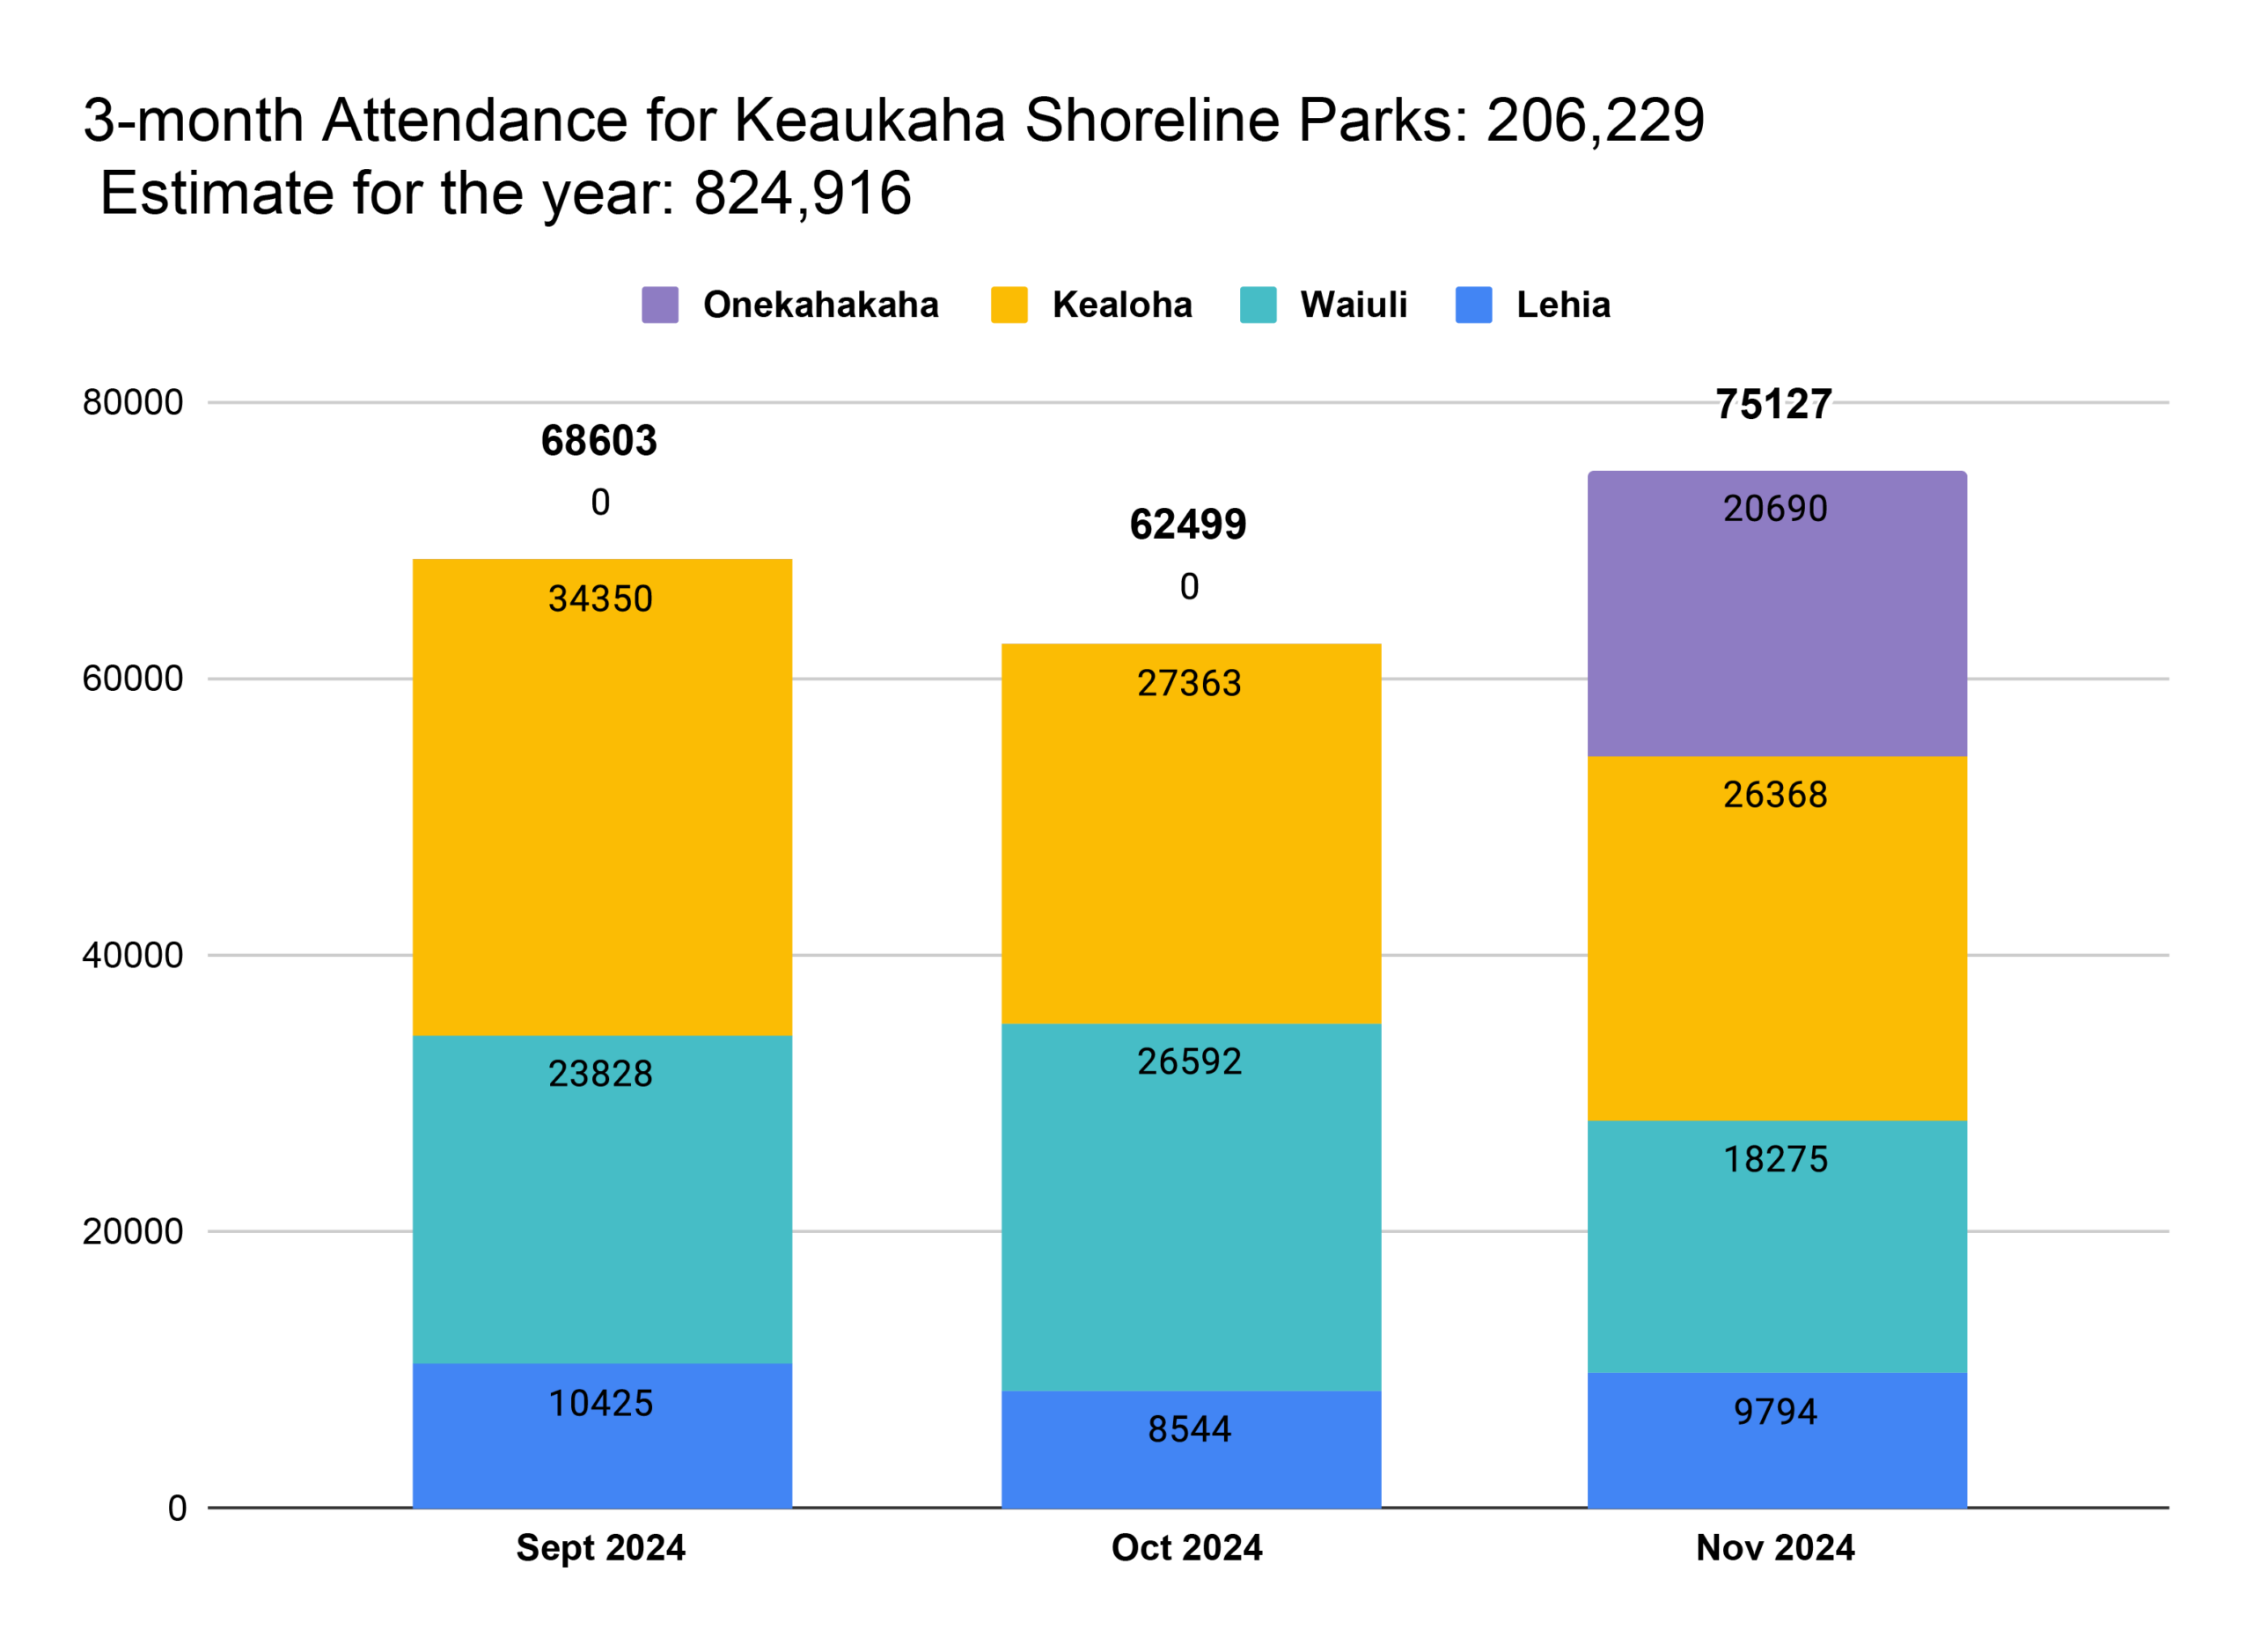
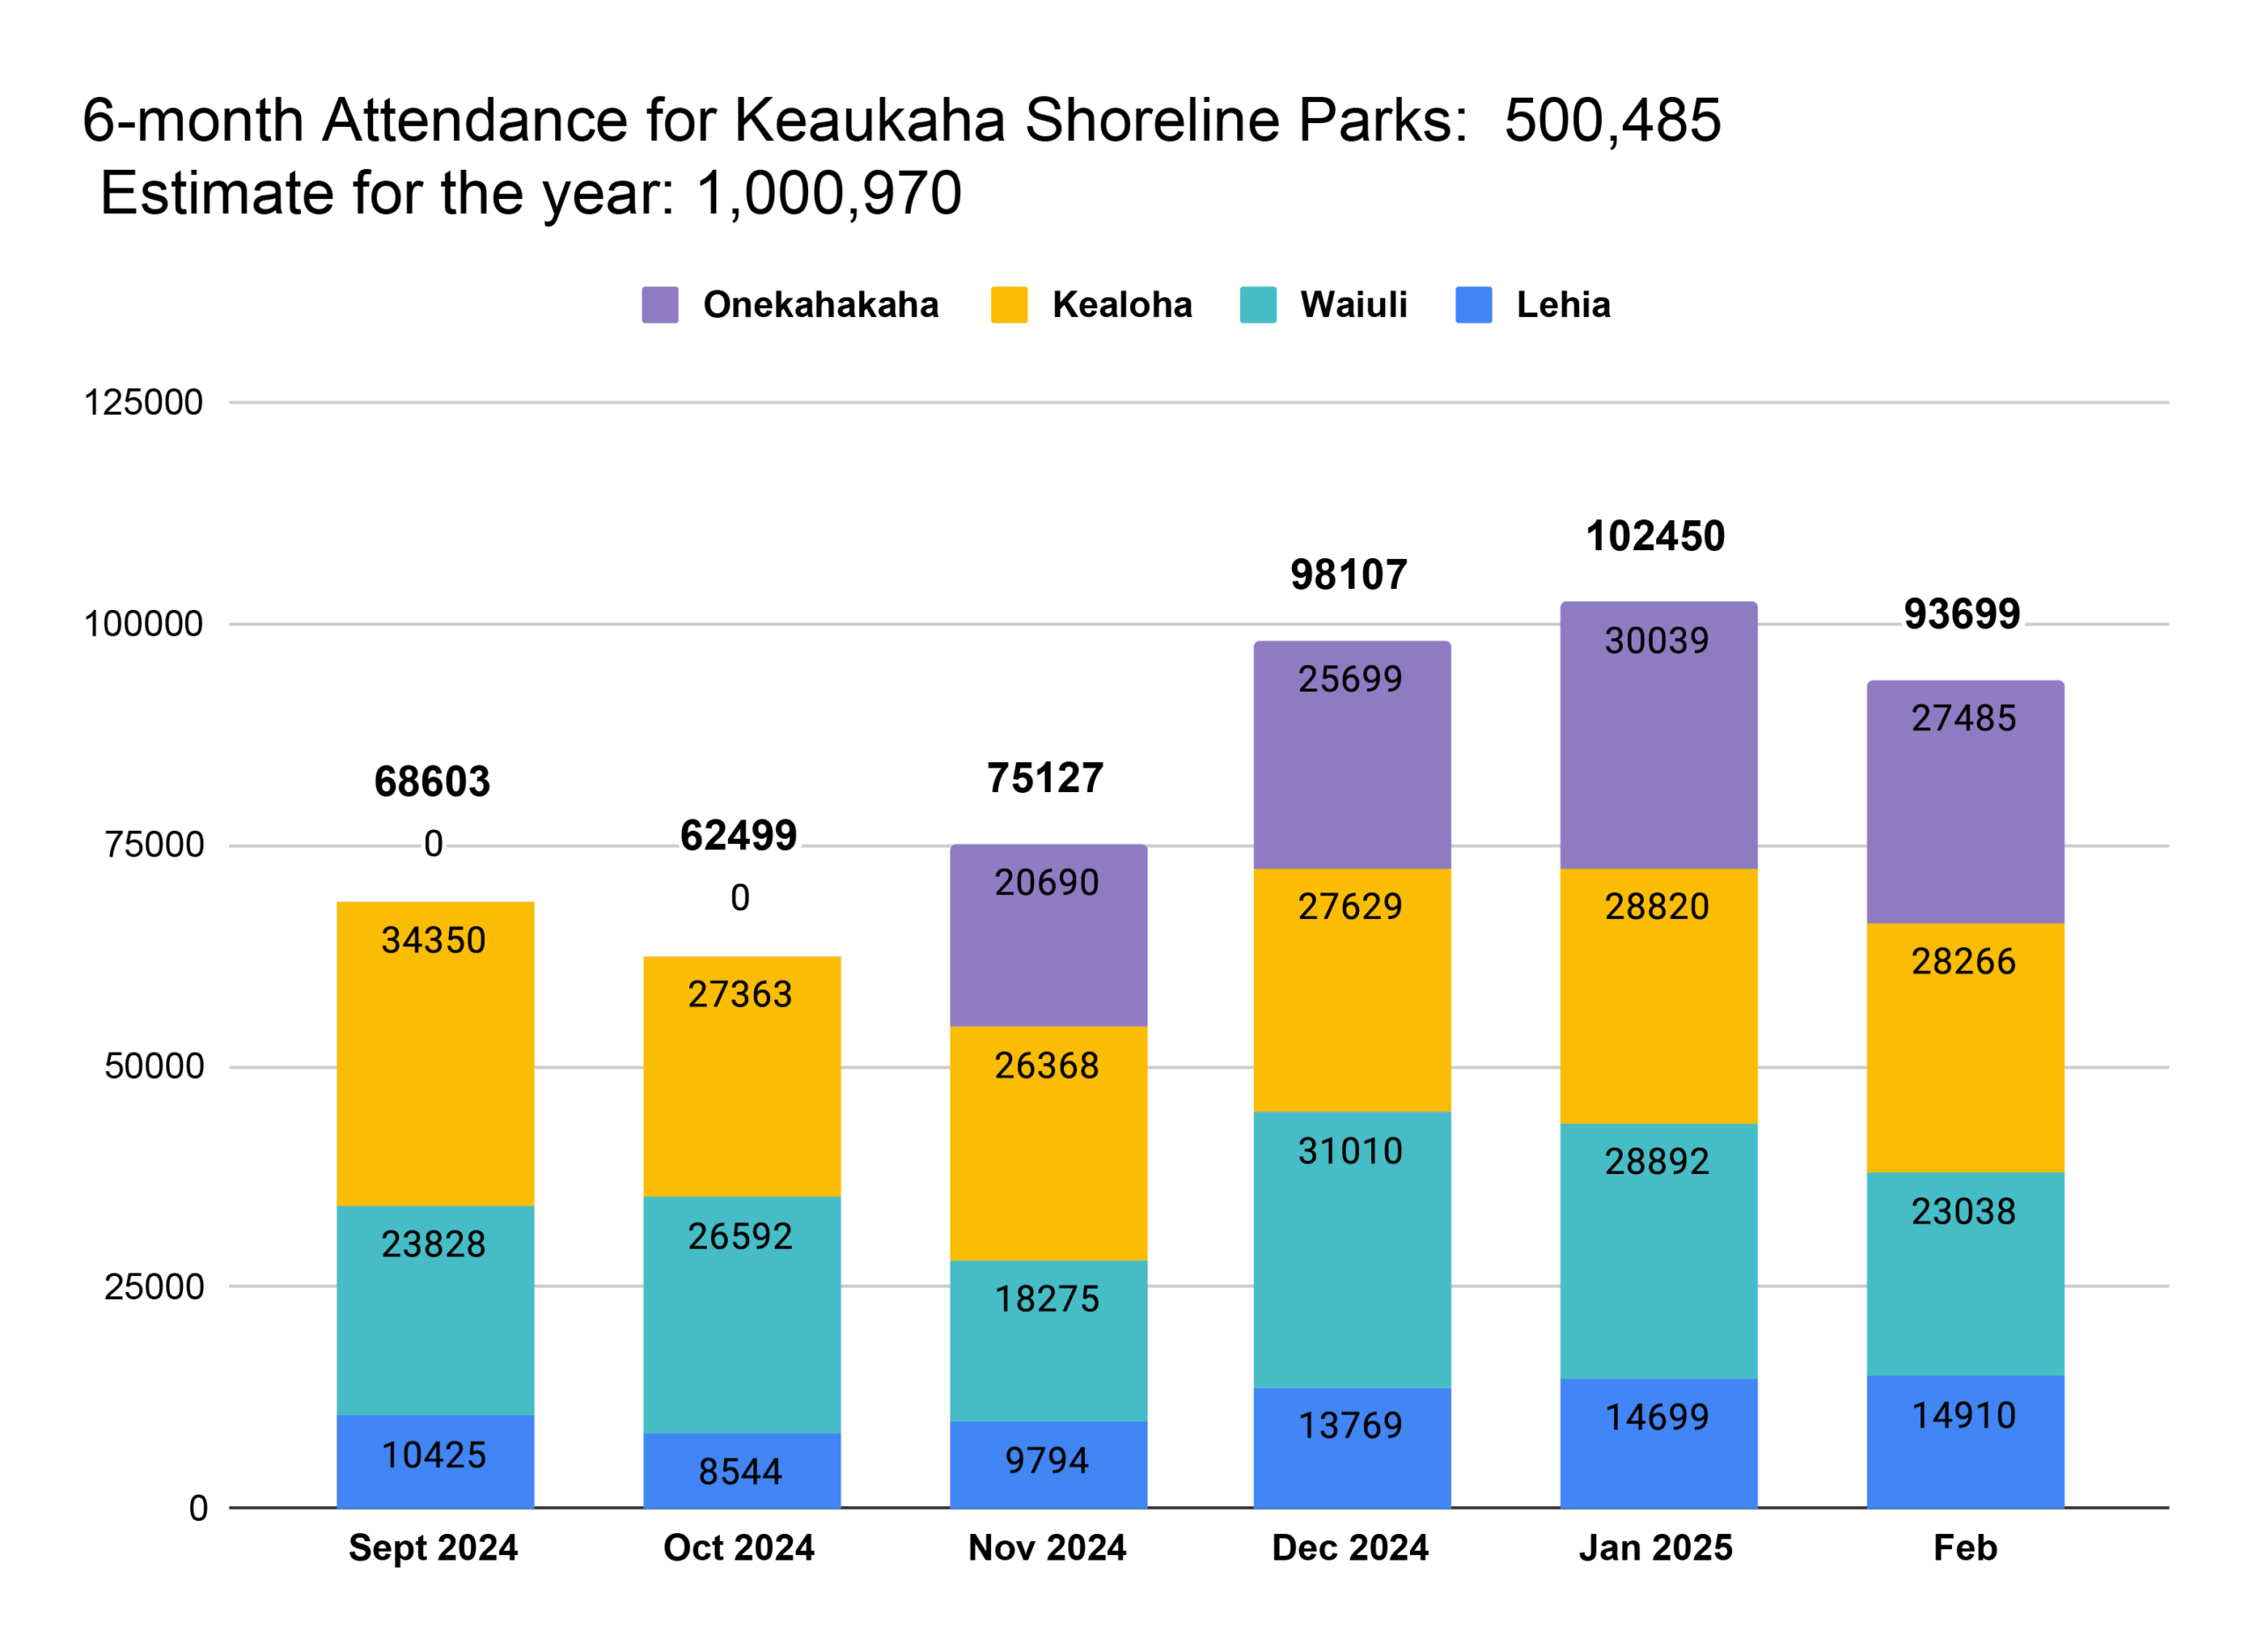
Image 4: shares the growth in commercial tourism activities and commercial use of Hawaii County beach parks. Data collection period is from 10/08/2024 and 1/20/206. Over the 15 month data collection period tourists accessing Waiuli park by way of commercial vans or buses have increased from an average of mid-300 people to upper 400-600 people a day.
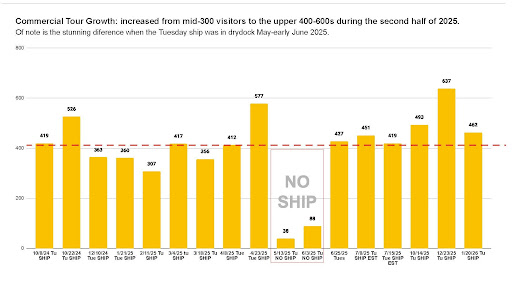
Image 5: This data graph differentiates the beach users at Waiuli Park between October 2025 and January 2026. This 4 months period of color coded data shows clearly the increase in the yellow color, which is commercial accessibility of Waiuli. Green bar represents (FIT) free and individual tourists. This means tourists arrive at the beach by rental car, local transit, or ride share like Uber. Light blue indicates community use of Waiuli, like schools or organizations. Dark blue data is residential access to Waiuli.
The middle data bar that is extremely shorter than the other data collections days, are park accessibility on non Cruise ship days.
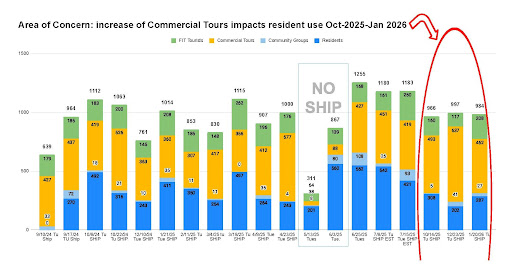
- The middle yellow bar is greater than or equal to residential accessibility of County beach resources.
- On some days, commercial accessibility almost doubles the residential access of Waiuli.